Recently I set up a proof-of-concept to add monitoring and alerting on the results of a query against a Microsoft SQL Server database table. I know there are a lot of ways to do this in the SQL server ecosystem, but I wanted to eventually be monitoring and alerting on metrics from many different sources - performance counters, Seq queries, and custom metrics exposed from a number of services. With this heterogeneity in mind I chose prometheus for this, and tacked on Grafana to give me some nice dashboards in the bargain.

Querying SQL Server
sql-agent is a fairly simple Go HTTP service that takes queries formatted as JSON and executes them against database back-ends, including Oracle, Postgres, and Microsoft SQL Server which is what I want to monitor and alert on for my proof-of-concept. There were no pre-build binary for this, but building it is very straight-forward.
Exposing SQL Queries to Prometheus
I used prometheus-sql to periodically query SQL Server. You can configure how frequently the query is run, which is independent of how frequently prometheus collects data from this service. You can tune these two parameters to be displaying and alerting on the live-est data possible without putting too much load on your SQL Server. Failed queries are re-tried using a back-off mechanism. Queries are defined in a config file, along with the connection details for executing the query. Once again - no pre-built binaries. Storing database credentials on the file system, and then passing them via HTTP or HTTPS to another server that blindly executes them doesn’t seem great to me from a security perspective, and to productionise this would probably require a number of other security mitigations to be put in place. Integrating sql-agent and prometheus-sql and using integrated authentication would be a step in the right direction. Although it wasn’t immediately apparent to me when I looked at the documentation sql-agent supports named instances too. Here is a very minimal queries.yml if you need help getting started.
- <your metric name goes here>:
    driver: mssql

    connection:
        host: localhost\InstanceName
        port: 1433
        user: <user name goes here>
        password: <password goes here>
        database: <db name goes here>

    sql: >
        select count(*) from Some_Table

    interval: 5m
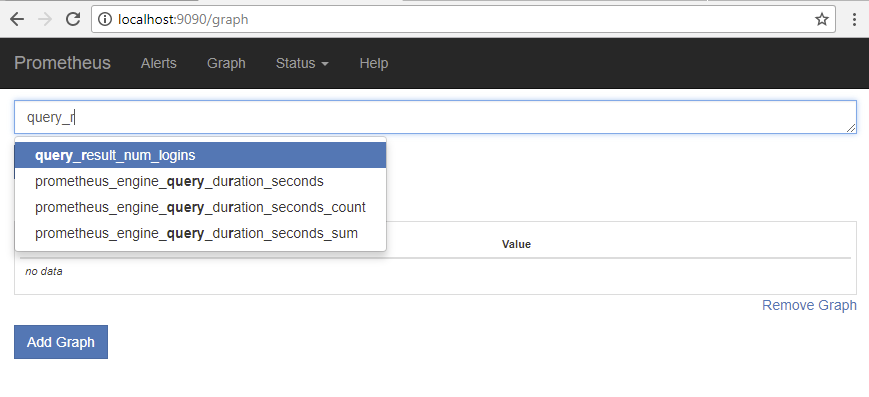
prometheus-sql exposes this via HTTP on port 8080 by default. Individual metrics will show up as http://localhost:8080/metrics?query_result_<metric_name>.
Collecting Metrics in Prometheus
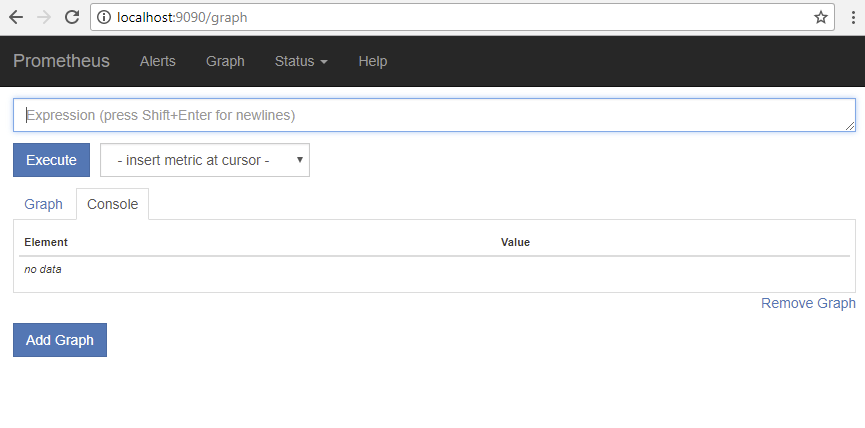
Like a lot of the tools from the golang ecosystem, Prometheus is beautifully simple to get up and running - download the binary for your platform, unzip it, and start running. If you do this and hit it on http://localhost:9090 you should see the following.
To add the prometheus-sql metrics to the set of metrics collected by Prometheus I added the following lines in the prometheus.yml file in the scrape_configs section.
  - job_name: 'sql'

    static_configs:
      - targets: ['localhost:8080']
Once you’ve added this and re-started prometheus your newly added metric should be visible.
Defining Alerts in Prometheus
Prometheus configures rules in a one or more rule files. I specified a single rule file called simple.rules in my prometheus.yml file.
rule_files:
   - "rules/simple.rules"
Since the metric I created was called was called num_logins, the name I should use for my alert seemed obvious.

And I defined it in the simple.rules file like this:
ALERT Num_Logins_Too_Dam_High
  IF query_result_num_logins > 10
  FOR 1m
  LABELS {
    severity = "warning"
  }
  ANNOTATIONS {
    summary = "the number of logins is too dam high",
    description = "Should be less than 10 but was {{$value}}",
  }
As you can see from the example above you can do templating in your alert text, which can get richer and more complicated when you have faceted metrics, or the same metric tracked for different instances. Check the docs.
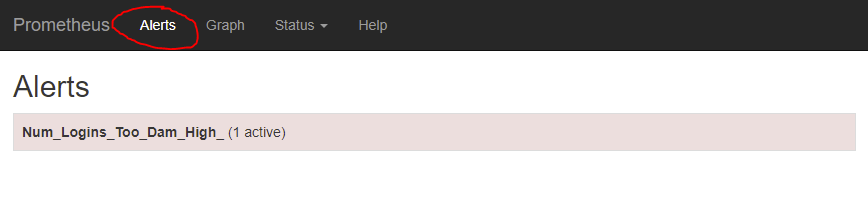
Once your alert is configured in prometheus (once again, requiring a re-start) it can be seen in the ‘Alerts’ section in Prometheus too.
Publishing Alerts With AlertManager
Prometheus has an add-on component called AlertManager which is responsible for sending out alerts via different channels like e-mail, slack, HipChat etc, as well as silencing, inhibiting and aggregating alerts. Once again, getting alert-manager running is a simple case of downloading the right binary for your platform and running the executable.
To provide the details for alert-manager to Prometheus I added the following section to the bottom of the prometheus.yml file (for high-availability, multiple independent prometheus instances can be configured to talk to multiple redundant alert-manager instances, which is why there are multiple alert managers that can be configured here, but for my demo I’m only using 1).
alerting:
  alertmanagers:
  - scheme: http
    static_configs:
    - targets:
      - "localhost:9093"
To publish my alerts to a slack channel via web hook I created an alertmanager.yml file in the same directory as the alertmanager executable, with the following contents.
global:
  slack_api_url: 'https://hooks.slack.com/services/<your super secret slack web hook key goes here>'

route:
  receiver: 'slack-notifications'
  group_by: [alertname, datacenter, app]

receivers:
- name: 'slack-notifications'
  slack_configs:
    - username: alertbot
      text: "\nsummary: {{ .CommonAnnotations.summary }}\ndescription: {{ .CommonAnnotations.description }}"
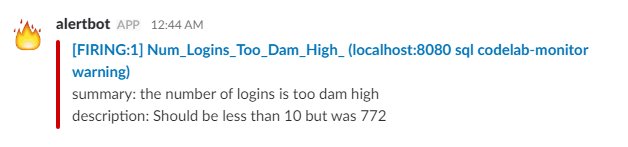
Which will show up in slack (after a little bit of appearance tweaking in slack) like this:
Note that because alert-manager throttles alerts based on severity, channel etc if you make some change to an alert and re-start alertmanager you probably won’t see a new alert being sent unless you change the name of the alert.
For a larger, more real-world setup, with multiple metrics, different levels of severity and channels for alerting (SMS, e-mail, slack) and different teams who should respond to those alerts this file would be much more complicated, but again for the proof-of-concept simplicity was all that was required.
Showing the Results in Grafana
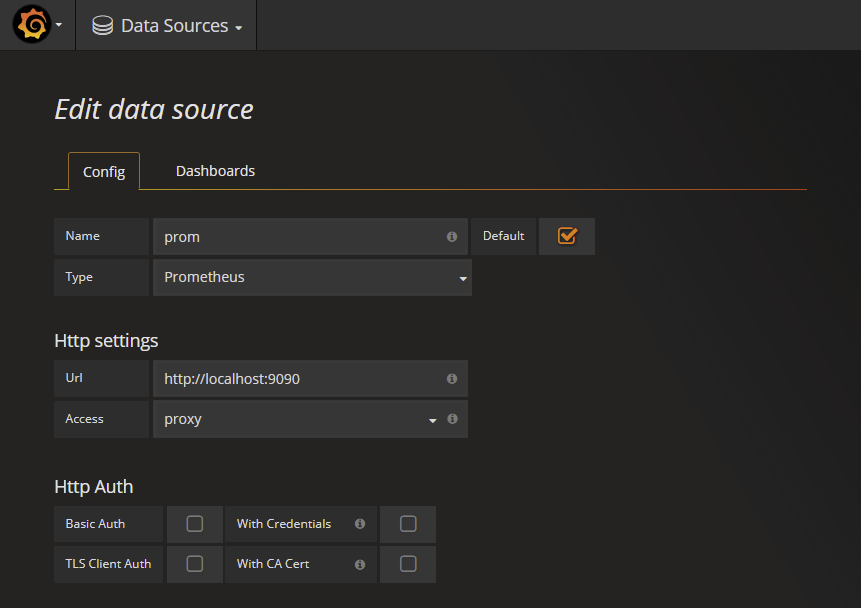
Grafana is great for making dynamic dashboards filled with charts and graphs to help you feel like you’re working on something really, really important. Check out their demo if you’re not convinced. Prometheus works with Grafana out-of-the-box so once I’d downloaded Grafana it was just a few clicks to add a new data source. Unlike all the other tools we’ve discussed this far, Grafana can be mostly configured via its web-based UI. After downloading and running it I navigated to http://localhost:3000/, logged in with the default credentials (admin, admin…another security wart to fix), chose ‘add data source’, choose the ‘type’ as prometheus, and then enter the URL for my locally running prometheus instance.
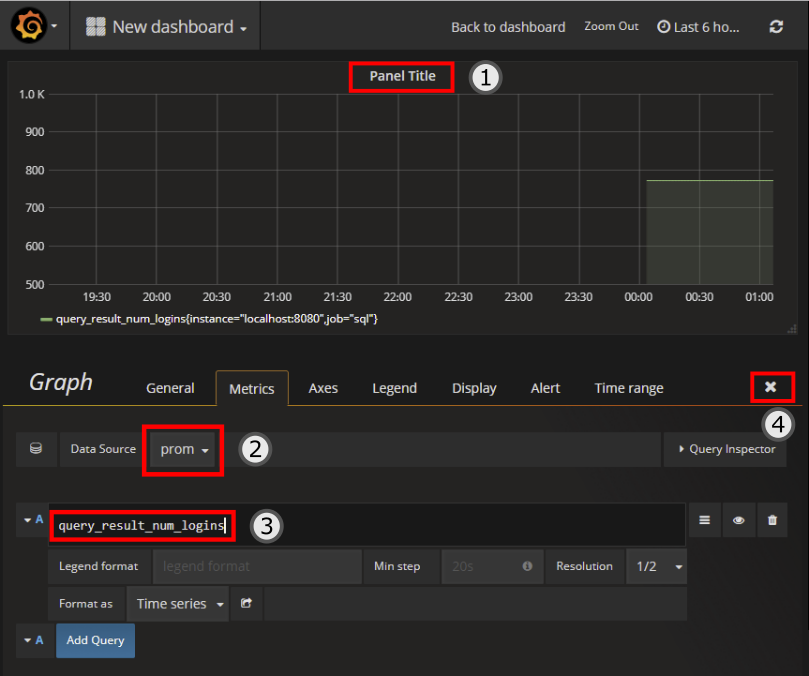
To add a prometheus metric to a new grafana dashboard
- Click the title of the default panel that is added to the new graph, and choose ‘Edit’ from the menu.
- Choose the name of the pometheus data source you added previously from the data-source drop-down.
- Enter the name of the metric you created earlier.
- Click the ‘x’ to complete editing.
You can then save the dashboard. There are many additional customisations you can do to your Grafana charts to make them look nice. Click the ‘Axes’, ‘Legend’ and ‘Display’ tabs shown above the data source (2) in the screen-shot below for further options you can change.
In the same way that prometheus has some basic graphing capabilities, but isn’t as good as Grafana, Grafana has simple alerting capabilities too. Although what I set up (above) with Alertmanager could be done in Grafana’s alerting too, Grafana is by all accounts much simpler than Prometheus/AlertManager’s alerting capabilities so I left it alone. YMMV.
Running All These as Services on Windows
I was running this whole setup on a single Windows machine (and without using much memory thanks to the niceties of GO), however because GO is quite platform-agnostic these were just plain old executables. So my lovely monitoring and alerting setup continued to run after I logged off I I used NSSM to run all these executables as a bunch of services.
Wrap-up
Tools from the golang ecosystem are nice to work with because they have no run-time dependencies. After creating this proof-of-concept on one machine I was able to zip it up and move it to another, and have it up and running as fast as I could launch new console windows. The tools themselves are fast, and have a very small memory footprint.
Some further work to secure all this properly is required, from the Grafana UI, to the HTTP services that expose the metrics and do the alerting, to the storage of the credentials.
Prometheus was the greek mythological figure that stole fire from the gods, and gave it to man. Prometheus.io is built by former google engineers, and heavily inspired by google’s borg-mon. It’s safe to say that the former google engineers though borg-mon was pretty important if they chose to make this analogy in their project’s name.
Image Credit: Prometheus Brings Fire to Mankind by Heinrich Friedrich Füger