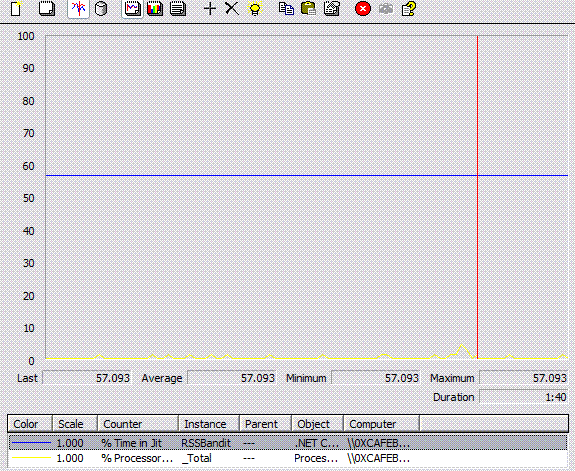
There are a number of .NET related performance counters you can view/log. One category of counters relates to JIT compilation, and includes a counter called “% Time in Jit”. This counter seems misleading to the point of being worthless. Take a look at the following graph of popular desktop news aggregator RSS Bandit’s %Time in JIT (RSS Bandit happened to be a .NET app I currently had running, you can repro this with ASP.NET apps etc also)
At casual glance this graph looks like RSS Bandit is spending almost 60% of its time in JIT, and has been doing so for over a minute. What was I doing in RSS Bandit at this time? Absolutely nothing. It was idle (not downloading any feeds), not searching, just running on the desktop. You can see from the CPU usage that the system is very lightly loaded. Yet the JIT performance counters would seem to indicate that the JIT compiler is under a fairly significant (and strangely consistent load). Reading the description of the performance counter yields the following:
Displays the percentage of elapsed time spent in JIT compilation since the last JIT compilation phase. This counter is updated at the end of every JIT compilation phase. A JIT compilation phase occurs when a method and its dependencies are compiled.